Safety and risk analysis
Bowtie analysis with barriers you can manage
AI-powered bowtie analysis in an all-in-one risk platform. An AI agent generates the whole diagram, with threats, consequences and preventive and mitigative barriers, from your documents; each barrier then links to the functions, assets, requirements and evidence behind it.
Overview
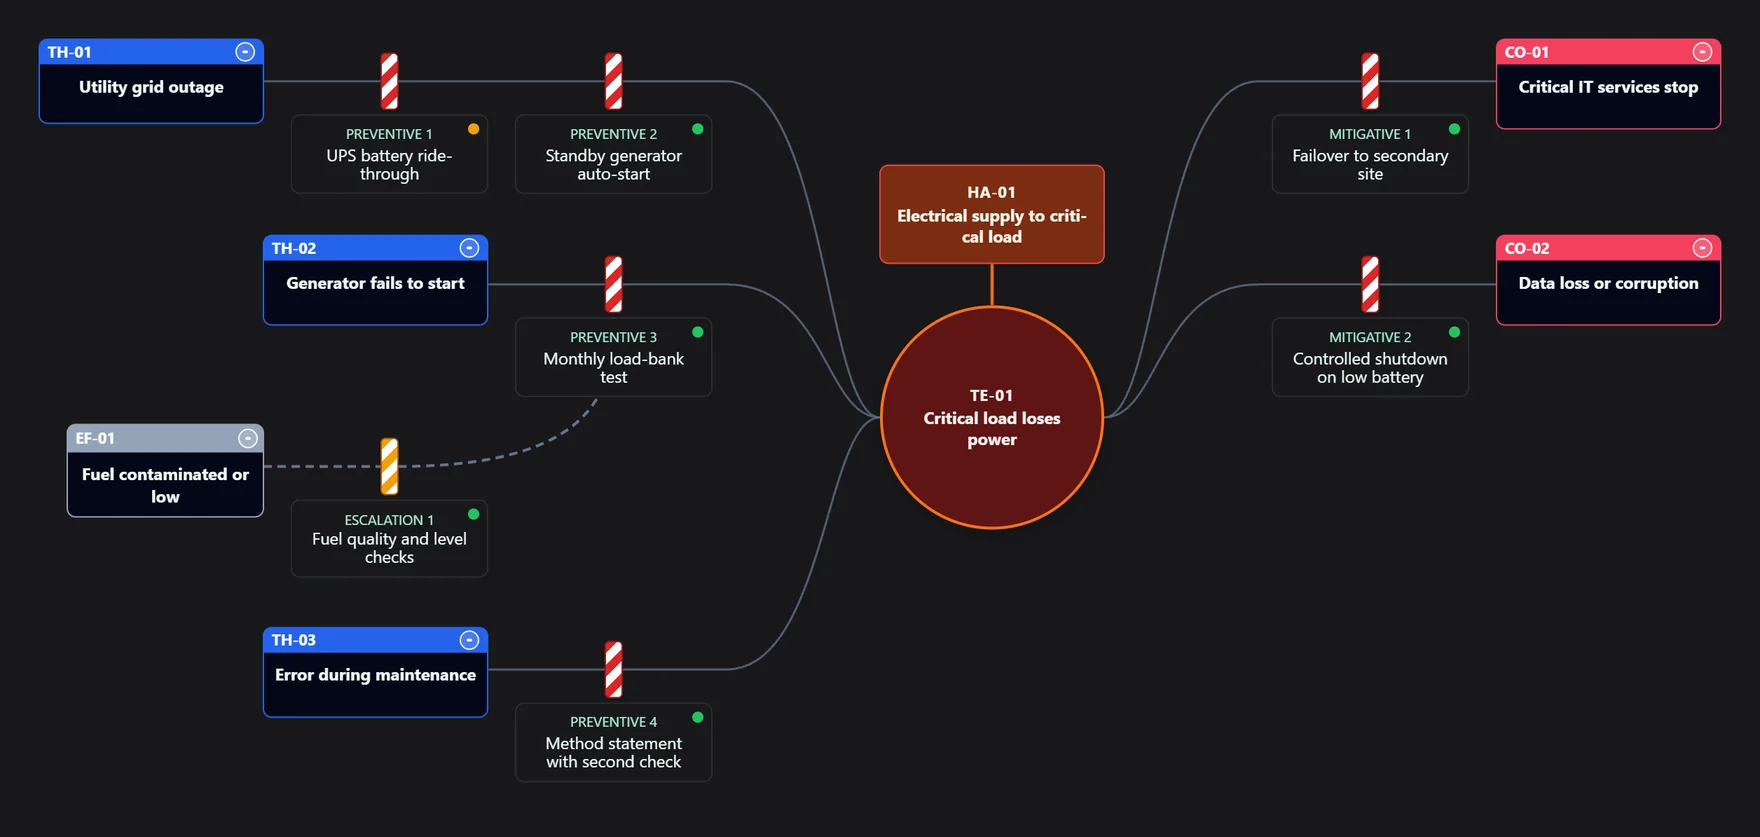
A bowtie diagram puts the top event, the moment control of a hazard is lost, in the middle. Threats on the left can cause it, consequences on the right can follow from it. Preventive barriers stop threats from reaching the top event, mitigative barriers limit the consequences, and escalation factors describe what can make a barrier fail.
In ModelGraphX a barrier is more than a box. Its inspector records owner, effectiveness, lifecycle state, condition, verification due date, failure modes and evidence, and links it to System Behavior functions, System Structure parts, real assets and requirements. The dashboard then flags degraded or impaired barriers, missing owners and evidence, and overdue verifications.
Every threat and consequence pair can be scored for likelihood and severity on a configurable risk matrix and published to the Risk Registry as a snapshot with provenance. The way-through panel guides teams through nine steps, from defining the hazard to keeping barriers healthy.
Capabilities
Complete bowtie elements
Hazard, top event, threats, consequences, preventive and mitigative barriers, escalation factors and escalation-factor barriers.
Barrier inspector
Owner, effectiveness, lifecycle, condition, verification due date, failure modes and evidence for every barrier.
Links to the system
Connect barriers to System Behavior functions, System Structure parts, real assets and requirements.
Barrier health dashboard
See degraded or impaired barriers, weak protection, missing owners or evidence, and overdue verifications.
Scenario scoring
Score each threat and consequence pair for likelihood and severity on a risk matrix of up to 12×12.
Publish to the Risk Registry
Send scored scenarios to the Risk Registry as snapshots with provenance.
The way through
A guided panel of nine steps in five phases, with progress and feedback loops.
Table view
Filter and choose fields in a table of all elements, and export it to CSV or Excel.
Reports and presentations
Export the diagram as an image or PDF, a presentation PDF, or a report in Word, PDF or PowerPoint.
Collaborative editing
Changes save per element so two people can edit different parts; conflicts are detected and unsaved changes can be restored.
History and recovery
Restore deleted elements for 180 days and return a diagram to an earlier revision.
Templates and collections
Start from a process safety template, save your own, and group analyses into collections.
AI assistance
- Generate a complete bowtie with filled-in barrier details from a hazard and top event, or by chat.
- Ground generation in uploaded documents, the Reference Library and Knowledge Repository examples, with a warning when there is nothing to ground on.
- Keep a history of generations so you can compare and reuse them.
AI proposals are drafts: you review and accept them before they enter your model.
Standards and methods
- ISO 31000
- Energy Institute bowtie methodology
ModelGraphX supports work done under these standards and methods; it does not certify compliance.
Who uses it
- Process safety and HSE engineers
- Major-hazard operators in oil and gas, chemicals and energy
- Barrier management and asset integrity teams
- Aviation, rail and mining safety managers
- Risk consultants who facilitate bowtie workshops
Works with
- Risk Registry
Scored scenarios publish to the Risk Registry.
- Hazard Management
Top events come from the hazard event register.
- System Behavior
Barrier functions link to the actions that perform them.
- Requirements
Barriers link to the requirements they satisfy.
- Asset Management
Barriers link to the real equipment that provides them.
- Safety Case
Threats, consequences and barriers can be cited as safety case evidence.
Frequently asked questions
- What is a bowtie diagram used for?
- A bowtie shows how a hazard can be released (threats leading to a top event) and what can follow (consequences), with the barriers that prevent or mitigate each path. It is widely used in process safety and barrier management because it makes the controls for one scenario visible on one page.
- Can ModelGraphX track barrier condition?
- Yes. Each barrier records owner, effectiveness, lifecycle state, condition and verification due date, and the dashboard flags degraded or impaired barriers, missing evidence and overdue verifications. Barrier condition is set by people; it is not derived automatically.
- Can AI create a bowtie?
- The Bowtie AI agent generates a full bowtie with barrier details from a hazard and top event or from a chat, grounded in your documents and reference library when you provide them. You review the result before using it. The AI agent depends on your plan.
- How do bowties connect to quantitative analyses?
- Scenarios publish to the Risk Registry, top events come from the event register that fault trees and event trees also use, and barriers link to requirements, functions and assets.
Try it on a real project
Explorer is free, and new accounts get a 30-day trial of the paid capabilities.