Safety and risk analysis
Dependability analysis with reliability block diagrams and SIL verification
Model how a system succeeds with reliability block diagrams, back every number with evidence, and calculate reliability, availability and maintainability. Verify safety instrumented functions against IEC 61508 and IEC 61511.
Overview
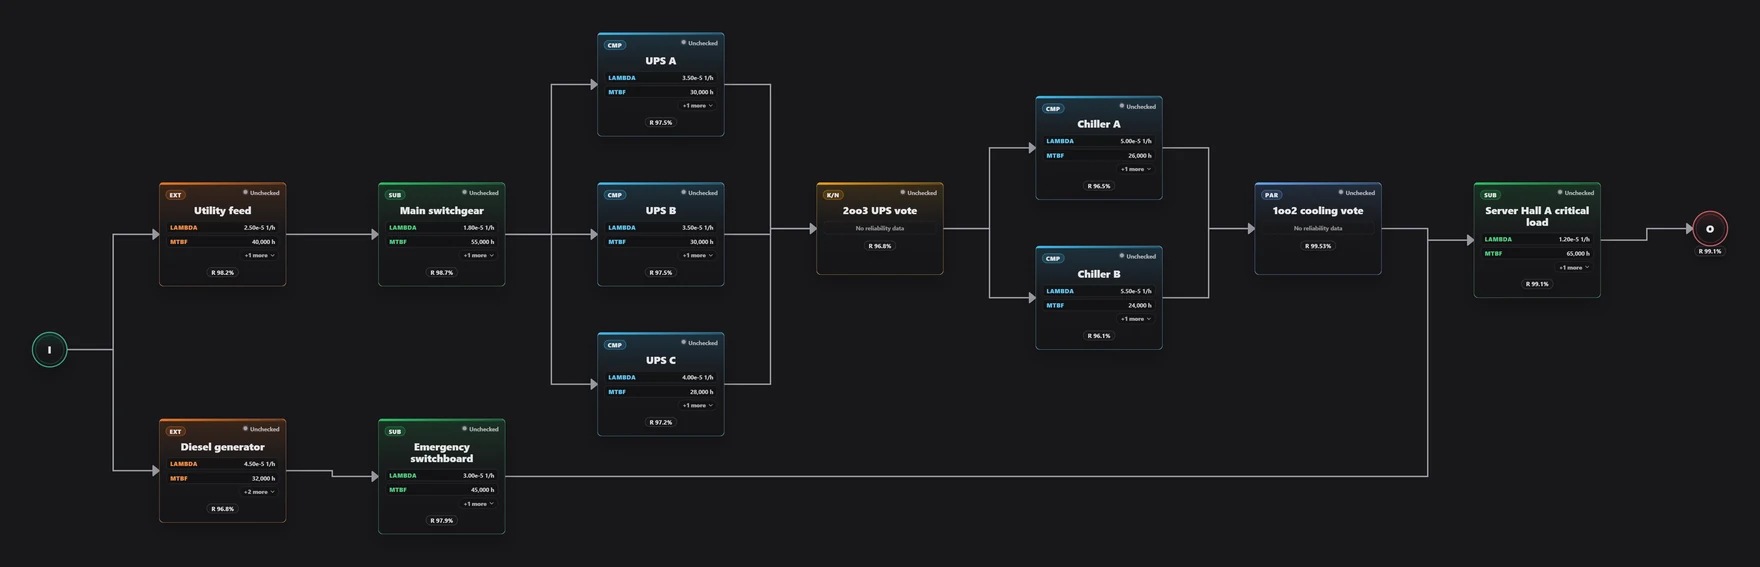
Dependability covers reliability, availability, maintainability and the data behind them. A reliability block diagram (RBD) shows which combinations of components must work for a function to succeed: blocks in series all have to work, parallel blocks give redundancy, and k-out-of-n blocks need a minimum number of working units.
In ModelGraphX each dependability study has a defined scope: system of interest, mission duration, lifecycle phase, operating environment, success criteria and assumptions. Functions under analysis trace to RBD blocks, and each block's data record carries its source, quality score and reviewer.
Before anything is calculated, validation checks mission duration, probability bounds, k-out-of-n settings, connectivity, cycles and missing evidence, each with a coded message. Results are point estimates, and Help documents every equation the module uses.
Capabilities
Reliability block diagrams
Draw series, parallel and k-out-of-n structures between input and output nodes, with automatic alignment.
Evidence-backed data
Record reliability, failure rate, MTTF, MTBF, MTTR, PFD and availability for each block, with source, quality score and reviewer.
Validation before calculation
Coded checks catch invalid mission durations, probability bounds, k-out-of-n settings, broken connectivity, cycles and missing evidence.
System results
Calculate system reliability, probability of failure, availability, unavailability, expected downtime and MTBF, MTTF and MTTR rollups.
Contributor ranking
See which blocks contribute most to unreliability so you know where design changes pay off.
Common-cause failures
Apply a beta-factor penalty to groups of blocks that can fail from a shared cause.
SIL verification
Calculate PFDavg or PFH for 1oo1, 1oo2, 2oo2, 2oo3 and 1oo3 subsystems with the IEC 61508-6 Annex B equations, including beta, proof-test coverage and repair time.
Architectural limits
The achieved SIL is limited by IEC 61511-1 minimum hardware fault tolerance, systematic capability and diagnostic coverage, and the result names the limiting factor.
Findings from results
Turn weak links and data gaps into findings with owners and status from the dashboard.
Reports
Export Word, PDF or PowerPoint reports with diagrams and results.
Templates
Start from a data centre critical services RBD or a process safety high-pressure trip SIF, and import or export your own templates.
Documented methods
Help lists every equation and every validation code, so reviewers can check how a number was produced.
AI assistance
- Draft a report summary of the study and its results that you review and accept.
AI proposals are drafts: you review and accept them before they enter your model.
Standards and methods
- IEC 61508
- IEC 61511
- Reliability block diagrams
ModelGraphX supports work done under these standards and methods; it does not certify compliance.
Who uses it
- Reliability and RAM engineers
- Functional safety engineers verifying safety instrumented functions
- Process safety teams in oil and gas, chemicals and energy
- Data centre and critical infrastructure engineers
- Maintenance and availability planners
Works with
- Fault Tree Analysis
Use fault trees for top-down failure logic and RBDs for success paths on the same system.
- Asset Management
Studies can pair with the real assets they describe, as in the data centre template.
- Safety Case
Dependability results can support claims in a safety case.
- FMEA
FMEA failure modes and dependability data describe the same components.
Frequently asked questions
- What is a reliability block diagram?
- An RBD shows the logical arrangement of components that must work for a system function to succeed. Series blocks must all work, parallel blocks provide redundancy, and k-out-of-n blocks need at least k of n units working. From block data you calculate system reliability and availability.
- Can ModelGraphX verify SIL for a safety instrumented function?
- Yes. It calculates PFDavg or PFH for common voting architectures with the IEC 61508-6 Annex B equations and limits the achieved SIL by the IEC 61511-1 architectural constraints, naming the limiting factor. Setting a target SIL with an automatic pass or fail verdict is not available yet.
- Does the module run Monte Carlo or uncertainty analysis?
- Not today. Calculations are deterministic point estimates, and Help documents every equation used.
- What is the difference between an RBD and a fault tree?
- An RBD models the paths by which a system succeeds; a fault tree models the combinations of events that cause a specific failure. For simple structures they are equivalent views. ModelGraphX has both, so you can use whichever fits the question.
Try it on a real project
Explorer is free, and new accounts get a 30-day trial of the paid capabilities.