Safety and risk analysis
Event tree analysis from initiating event to end state
AI-assisted event tree analysis, integrated with your fault trees and hazards. Follow an initiating event forward through the success or failure of each barrier to every outcome, let an AI agent draft the tree, and compute sequence probabilities, frequencies and expected consequences, deterministically or with Monte Carlo.
Overview
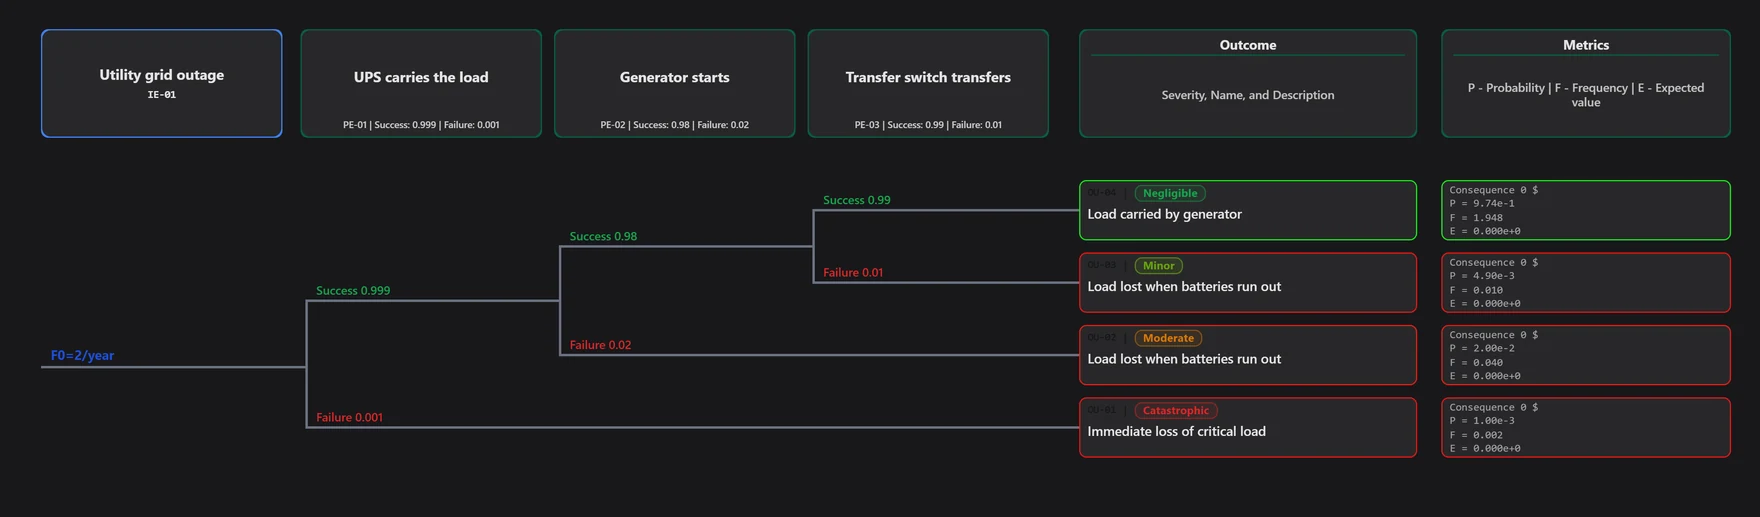
Event tree analysis (ETA) is an inductive method. It starts from an initiating event, such as a pipe rupture or loss of power, and branches at each pivotal event, typically a safety function that works or fails. Each path through the tree is a sequence that ends in an outcome with its own probability and consequence.
In ModelGraphX the probability of a sequence is the product of its branch probabilities, and a two-branch node infers its complement automatically. With an initiating-event frequency you also get sequence frequencies and expected values, and time-bounded probabilities use the Poisson or rare-event form.
When inputs are uncertain, Monte Carlo samples them from distributions while keeping each branch set summing to one, and reports the mean with p10, p50 and p90 bands. A pivotal event's probability can come straight from a saved fault tree run.
Capabilities
Tree building
Add an initiating event, pivotal-event stages and outcomes; connections are forward and acyclic.
Three canvas views
Switch between full, classic stage-column and on-branch layouts, and move or hide pivotal events.
Deterministic compute
Get sequence probabilities, frequencies and expected values from branch probabilities and the initiating-event frequency.
Monte Carlo simulation
Run 100 to 50,000 reproducible trials with point, uniform, triangular, PERT, normal, lognormal, gamma or beta inputs.
Confidence bands
See mean, p10, p50 and p90 for each sequence, with percentile-band charts on the dashboard.
Pivotal-event importance
Fussell–Vesely, risk achievement worth and risk reduction worth show which barriers drive scenario risk.
Tables
Work with nodes, branches, sequences, cut sets, importance, risk matrix, outcomes and results in tables, with a bulk outcome editor.
Saved runs and dashboard
Keep calculation runs and compare them on an analytics dashboard.
Fault tree import
Take a pivotal event's probability from the top event of a saved fault tree run.
Risk Registry and hazards
Publish nodes to the Risk Registry and link them to a hazard scenario.
Reports
Report the initiating event, pivotal events and sequences with an AI summary, exported to Word, PDF or PowerPoint.
Templates and examples
Start from examples such as a chemical toxic release, pressure-vessel overpressure or dam safety, and save your own templates.
AI assistance
- Generate an event tree proposal that you review before it replaces the tree or creates a new one.
- Ground generation in Reference Library documents and Knowledge Repository examples.
- Revise a whole proposal, one stage or one outcome in chat, and reapply earlier generations.
AI proposals are drafts: you review and accept them before they enter your model.
Standards and methods
- Probabilistic risk assessment (PRA)
ModelGraphX supports work done under these standards and methods; it does not certify compliance.
Who uses it
- Process safety and quantitative risk analysts
- Nuclear and energy probabilistic safety teams
- Dam safety and hydropower engineers
- Transport and infrastructure risk consultants
Works with
- Fault Tree Analysis
Pivotal-event probabilities can come from fault tree runs.
- Hazard Management
Initiating events and nodes link to hazard scenarios.
- Risk Registry
Nodes can be published to the Risk Registry.
- Bowtie Analysis
Bowties show barriers qualitatively; event trees quantify what happens when they fail.
- Reference Library
AI generation can be grounded in your reference documents.
Frequently asked questions
- What is the difference between an event tree and a fault tree?
- A fault tree works backward from an undesired event to its causes. An event tree works forward from an initiating event through the success or failure of barriers to its possible outcomes. They are often used together, and in ModelGraphX a pivotal event can take its probability from a fault tree run.
- Can I run Monte Carlo on an event tree?
- Yes. Monte Carlo samples branch probabilities and frequencies from distributions such as triangular, PERT or lognormal, keeps each branch set summing to one, and reports mean and p10, p50 and p90 values. Monte Carlo depends on your plan.
- Can I calculate expected consequences?
- Yes. Give the initiating event a frequency and outcomes a consequence value, and ModelGraphX computes sequence frequencies and expected values.
- Can AI draft an event tree?
- The ETA AI agent generates a proposal from your description, optionally grounded in your reference documents. You review it before it replaces the tree or becomes a new one.
Try it on a real project
Explorer is free, and new accounts get a 30-day trial of the paid capabilities.