Safety and risk analysis
Fault tree analysis with exact quantification
AI-driven fault tree analysis in your browser. An AI agent drafts trees from your documents for you to review; you build them out with nine gate types and six event types, then compute the exact top-event probability, minimal cut sets and importance measures on the server.
Overview
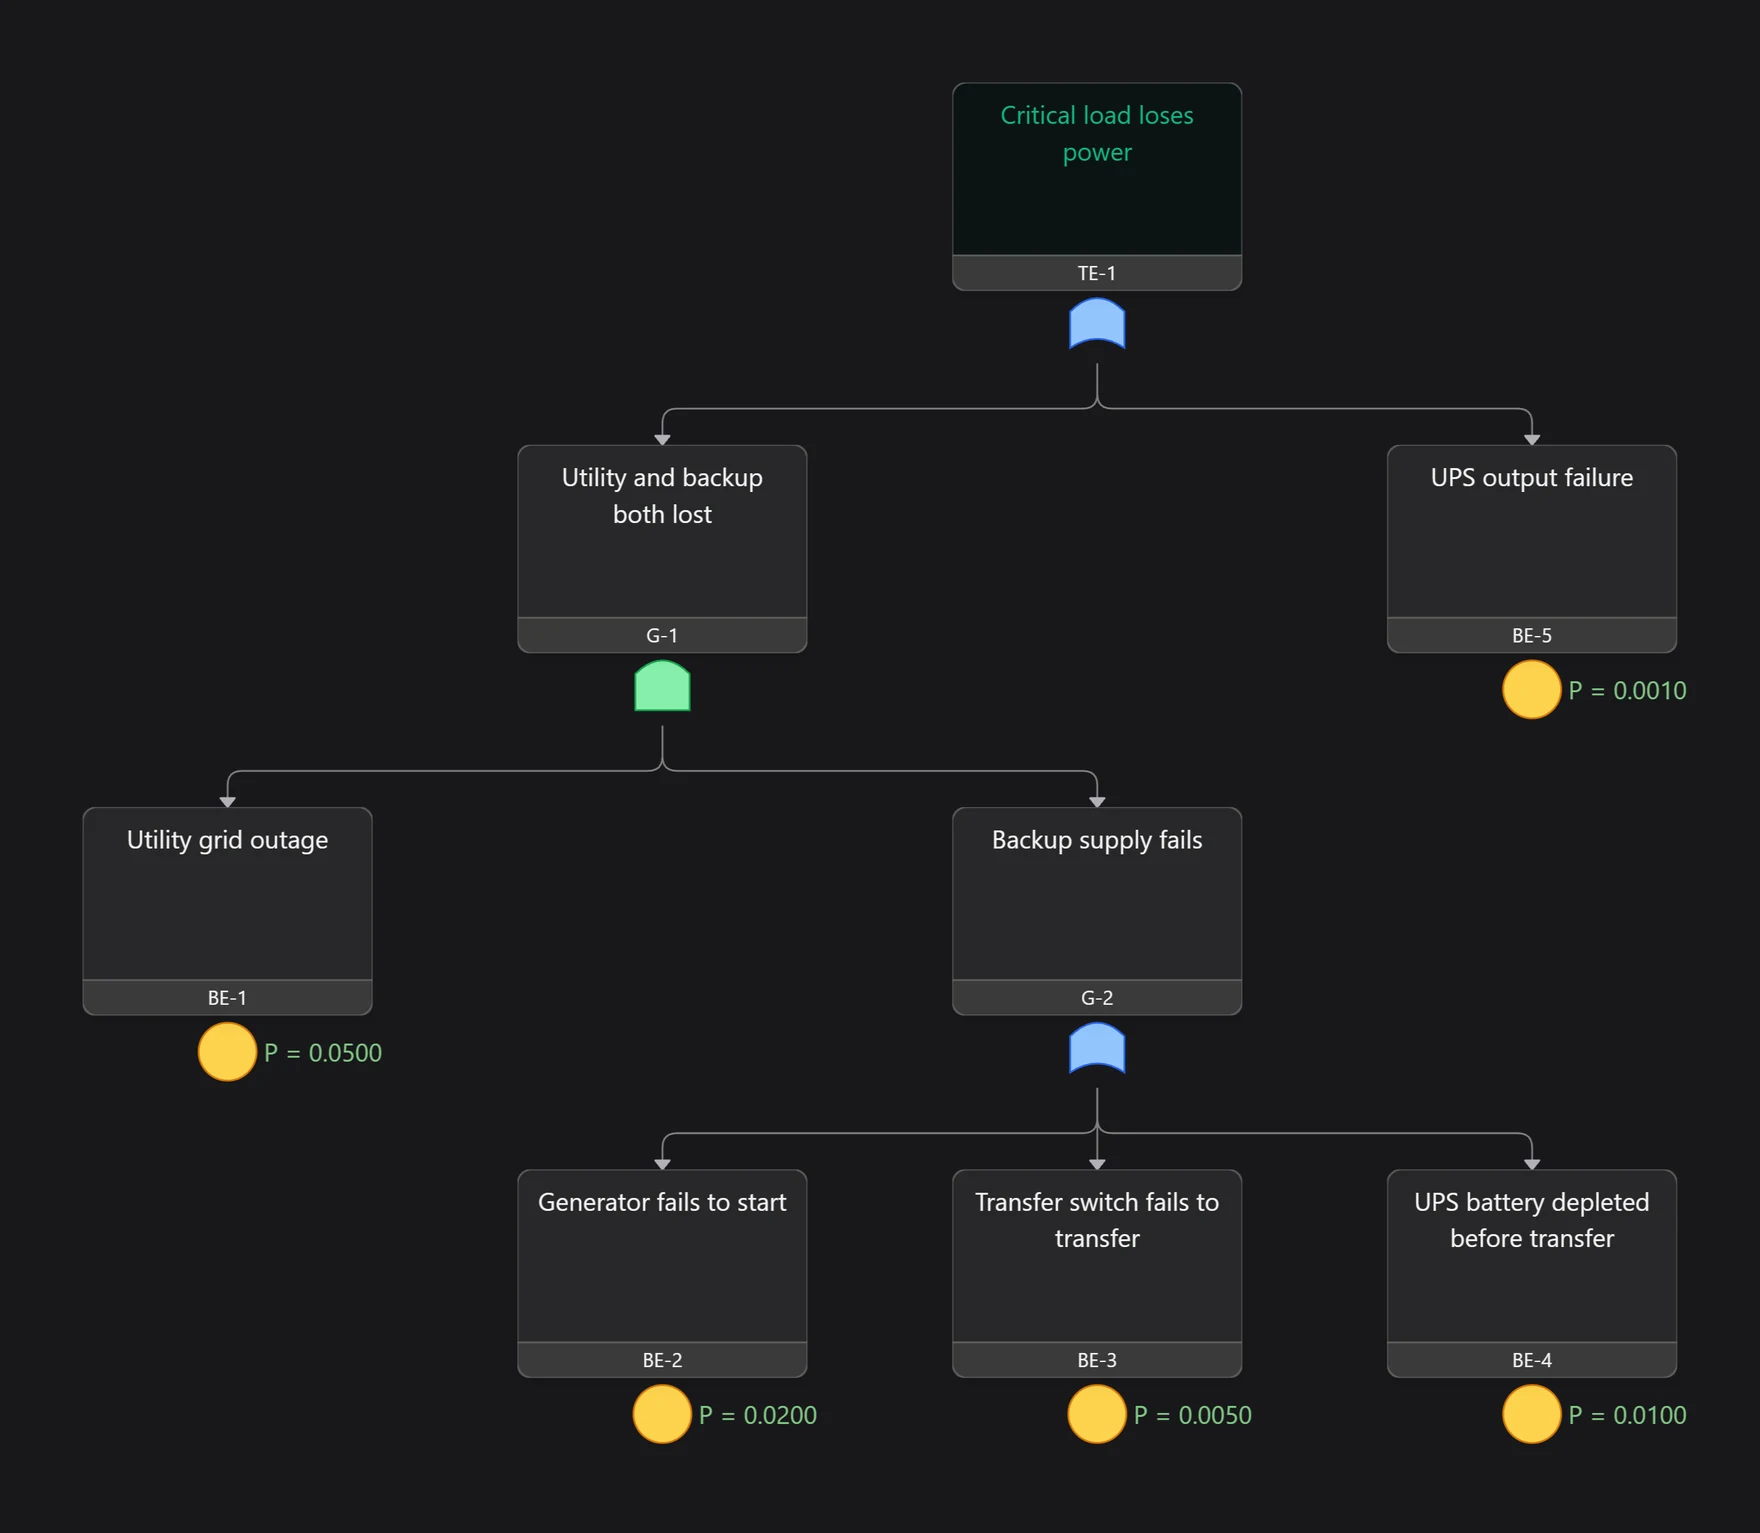
Fault tree analysis (FTA) starts from an undesired top event, such as loss of braking or a toxic release, and works downward through logic gates to the basic events that can cause it. The result shows which combinations of failures lead to the top event, and how likely it is.
ModelGraphX computes the top-event probability exactly with a reduced ordered binary decision diagram rather than a rare-event approximation, so repeated events, common-cause groups and dependencies are handled correctly. Minimal cut sets come from the same diagram, and the rare-event and upper-bound approximations are shown beside the exact value.
A health check catches structural errors before you compute, and a fingerprint warns when a saved run no longer matches the tree. Large trees can be split into linked subtrees, and deleted events can be restored for 180 days.
Capabilities
Nine gate types
AND, OR, voting k-out-of-N, XOR, INHIBIT, priority AND, NOR, NAND and NOT.
Six event types
Basic, undeveloped, dormant, house, conditioning and transfer events.
Exact top-event probability
A server-side binary decision diagram engine computes the exact result, with no rare-event approximation.
Probabilities or failure rates
Give basic events a fixed probability, or a failure rate over a mission time in hours, days, weeks, months or years.
Repeated events and common cause
Share event definitions across the tree, model beta-factor common-cause groups and declare dependencies.
Minimal cut sets
Get up to 2,000 minimal cut sets per run with their probabilities, and see when a tree is non-coherent.
Importance measures
Birnbaum, Fussell–Vesely, risk achievement worth and risk reduction worth for every basic event.
Health check and run tracking
Find structural errors before computing, and see when a saved run is out of date with the tree.
Subtrees and templates
Split a branch into its own tree behind a transfer event, link and merge subtrees, and reuse private templates.
Diagram and table export
Export diagrams to PNG, JPEG, SVG, PDF or PowerPoint, tables to Excel, and a tree with its subtrees as a JSON bundle.
Reports
Produce a report with an AI-drafted summary and export it to Word, PDF or PowerPoint.
History
Restore deleted events for 180 days, keep versions in the tree properties and follow the activity log.
AI assistance
- Draft a skeleton or a full fault tree, grounded in your own documents with citations when you choose strict or assisted grounding.
- Expand a selected node with proposed causes.
- Answer questions about the tree in chat.
- Propose the top event, critical basic events and dominant cut sets to the Risk Registry. Leaf values drafted by AI must be confirmed before you compute.
AI proposals are drafts: you review and accept them before they enter your model.
Standards and methods
- IEC 61025
- MIL-HDBK-338B
ModelGraphX supports work done under these standards and methods; it does not certify compliance.
Who uses it
- Reliability and system safety engineers
- Aerospace, rail and automotive safety teams
- Nuclear, process and energy risk analysts
- Functional safety engineers
- Students learning quantitative risk analysis
Works with
- Event Tree Analysis
An event tree can take a pivotal event's probability from a saved fault tree run.
- Risk Registry
Top events, critical basic events and dominant cut sets can be proposed to the Risk Registry.
- System Structure
Events link to the system elements or assets they describe.
- STPA / CAST
STPA loss scenarios and CAST factors can seed a fault tree.
- Hazard Management
Top events can come from the hazard event register.
Frequently asked questions
- How does ModelGraphX calculate the top-event probability?
- With an exact binary decision diagram engine on the server. It does not use the rare-event approximation, so repeated events, common-cause groups and dependencies are handled exactly. The rare-event and minimal cut set upper-bound values are shown alongside for comparison.
- Does it find minimal cut sets?
- Yes, up to 2,000 per run with their probabilities, together with Birnbaum, Fussell–Vesely, RAW and RRW importance measures for every basic event.
- Can AI build a fault tree for me?
- The FTA AI agent can draft a skeleton or a full tree and expand selected nodes. With strict or assisted grounding it works from your documents and adds citations. Values it drafts for leaf events must be confirmed before you compute.
- Is quantitative analysis included in every plan?
- Building trees and finding cut sets from the saved tree is available to everyone. Probability computation and AI expansion depend on your plan; the pricing page lists what each plan includes.
- Does it support dynamic fault trees?
- Priority AND gates check input order, but timing is not modelled, so ModelGraphX does not perform dynamic fault tree analysis.
Try it on a real project
Explorer is free, and new accounts get a 30-day trial of the paid capabilities.